 button in the lower right side of the bench application (see also Application Settings).
The Power Meter application offers multiple measurement display options for viewing measurements on the Display 1 or Display 2 tab. Up to four display views can be added per tab. The following display options are available:
To configure the display settings, such as measurement acquisition rate, display resolution, and measurement timeout, click the Application Settings button in the lower right side of the bench application (see also Application Settings).
Note: For the 2040/50/60 X-Series, the default Channel Setup mode is AVG only. The mode will automatically change to the Normal mode when the Trace View display mode is selected. Since the Normal mode provides a lower dynamic range, the measurable power range will also be reduced. To obtain a wider dynamic range for low-power measurements (less than -40 dBm), close the Trace View window and select the AVG only mode. A warning message will appear if you attempt to select the AVG only mode with a Trace View window open.
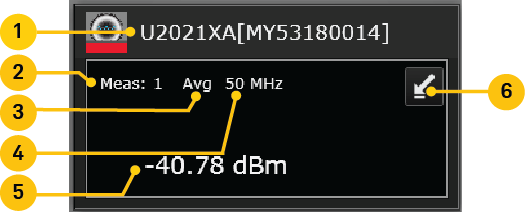
| 1 | Model number and serial number of the connected instrument |
| 2 | Measurement number |
| 3 | Measurement type |
| 4 | Measured frequency |
| 5 | Measurement value |
| 6 | Switch back to Full mode display |
Creating a Compact Mode Display

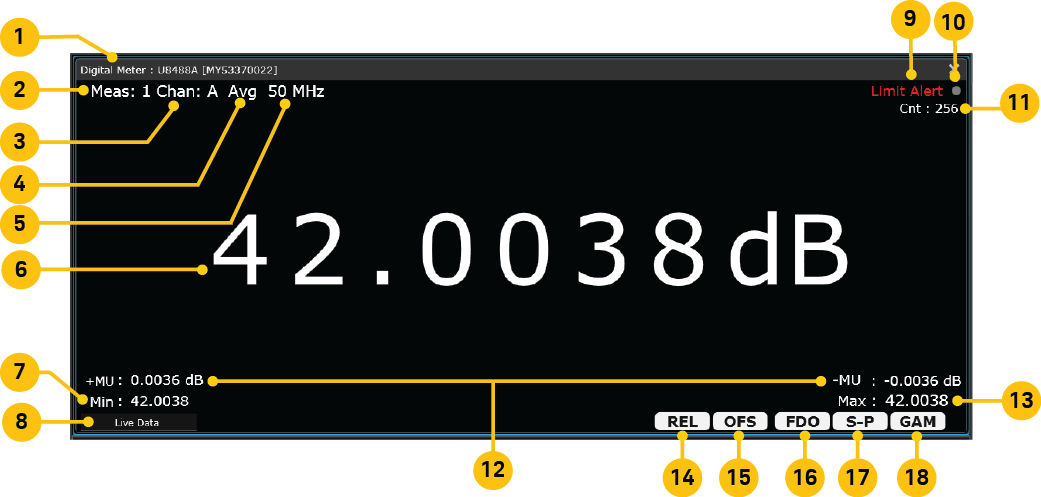
| 1 | Model number and serial number of the connected instrument |
| 2 | Measurement number |
| 3 | Channel name |
| 4 | Measurement type |
| 5 | Measured frequency |
| 6 | Measurement value |
| 7 | Minimum measured value |
| 8 | Measurement status |
| 9 | Limit alert status |
| 10 | Measurement acquisition indicator |
| 11 | Average count |
| 12 | Measurement Uncertainty (MU) can only be enabled for U8480 Series USB thermocouple power sensors |
| 13 | Maximum measured value |
| 14 | Relative Measurement enabled |
| 15 | Channel or Measurement Offsets enabled |
| 16 | FDO Correction enabled |
| 17 | S-Parameter Correction enabled |
| 18 | Gamma Correction enabled |
Creating a Digital Meter Display
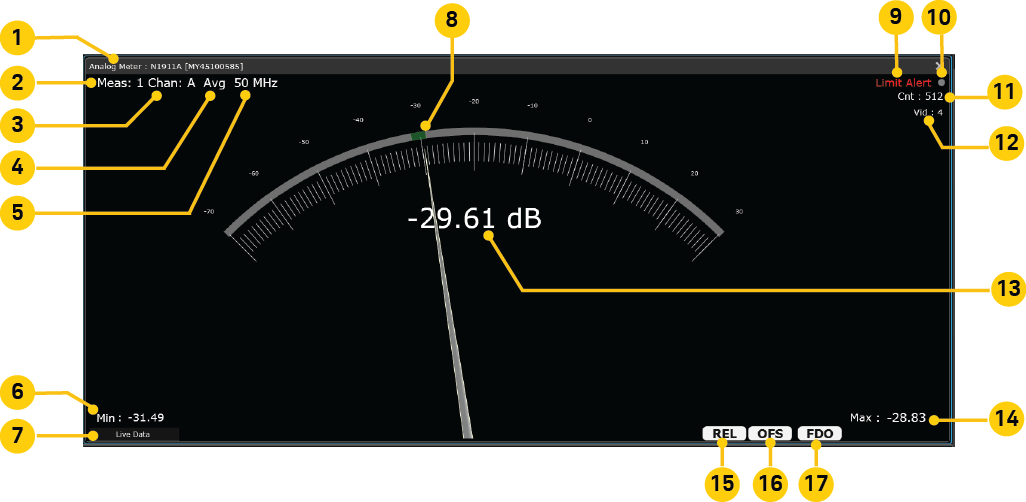
| 1 | Model number and serial number of the connected instrument |
| 2 | Measurement number |
| 3 | Channel name |
| 4 | Measurement type |
| 5 | Measured frequency |
| 6 | Minimum measured value |
| 7 | Measurement status |
| 8 | The area shown in green indicates the range of measurements between current minimum and maximum values. |
| 9 | Limit alert status |
| 10 | Measurement acquisition indicator |
| 11 | Average count |
| 12 | Video average |
| 13 | Measurement value |
| 14 | Maximum measured value |
| 15 | Relative Measurement enabled |
| 16 | Channel or Measurement Offsets enabled |
| 17 | FDO Correction enabled |
Creating an Analog Meter Display
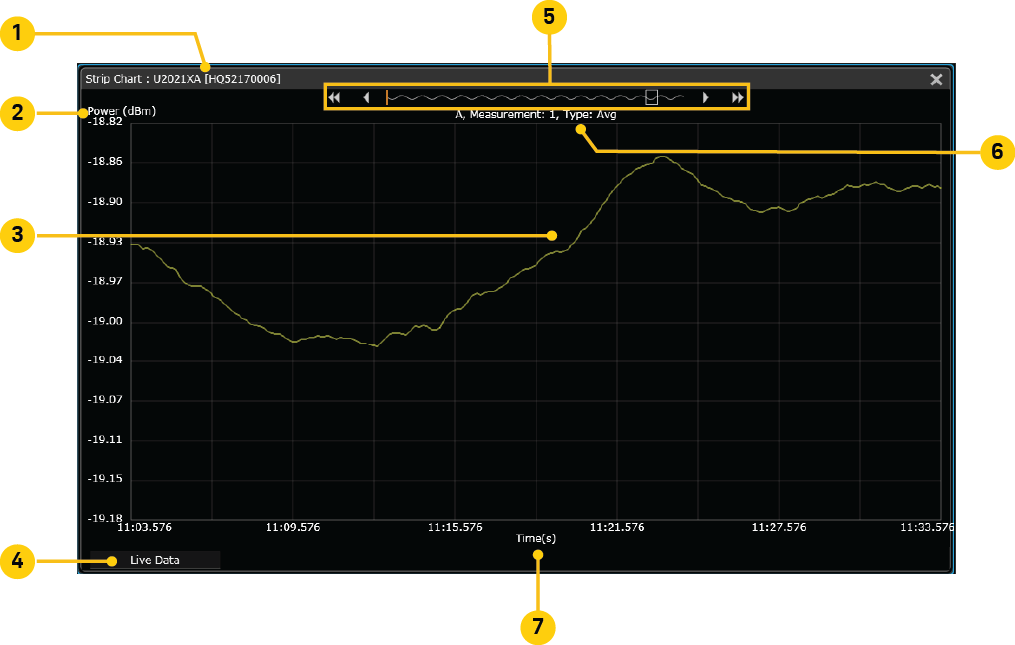
| 1 | Model number and serial number of the connected instrument |
| 2 | Y-axis value and unit |
| 3 | Strip chart display |
| 4 | Measurement status |
| 5 | Data Preview bar |
| 6 | Channel name, Measurement number, Measurement type |
| 7 | X-axis value and unit |
Creating a Strip Chart View Display
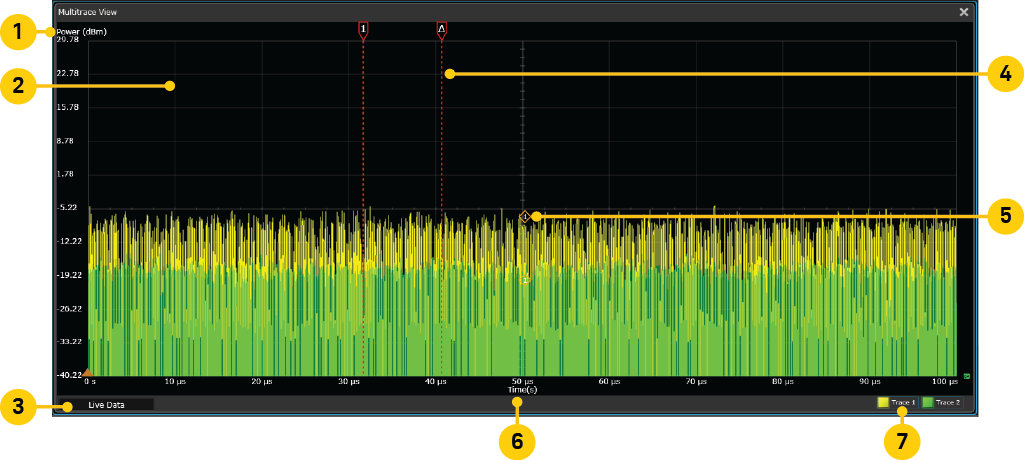
| 1 | Y-axis value and unit |
| 2 | Trace graph display |
| 3 | Measurement status |
| 4 | Measurement gate line |
| 5 | Measurement marker point |
| 6 | X-axis value and unit |
| 7 | Trace selector buttons |
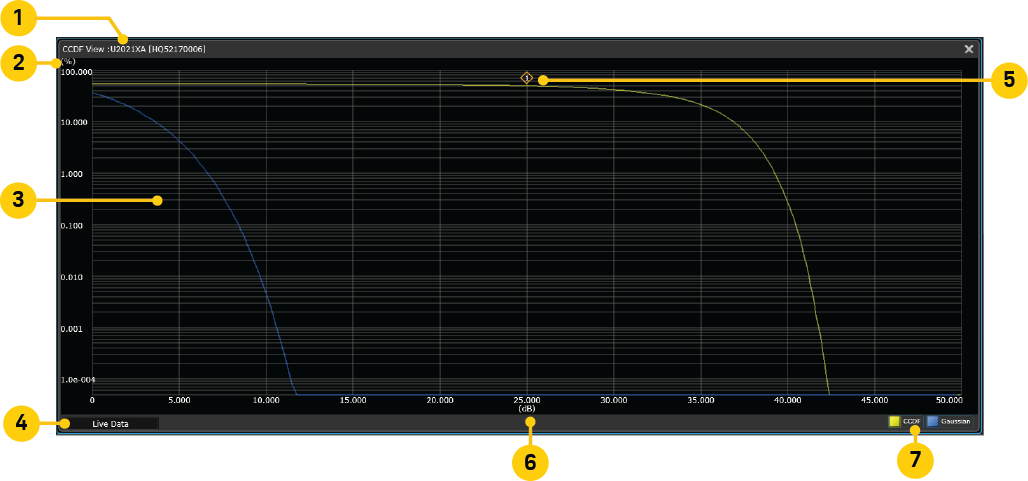
| 1 | Model number and serial number of the connected instrument |
| 2 | Y-axis value as the percentage of the time the signal power is at or above the power specified by the x-axis. |
| 3 | Trace graph display |
| 4 | Measurement status |
| 5 | Measurement marker point |
| 6 | X-axis value and unit |
| 7 | Trace selector buttons |
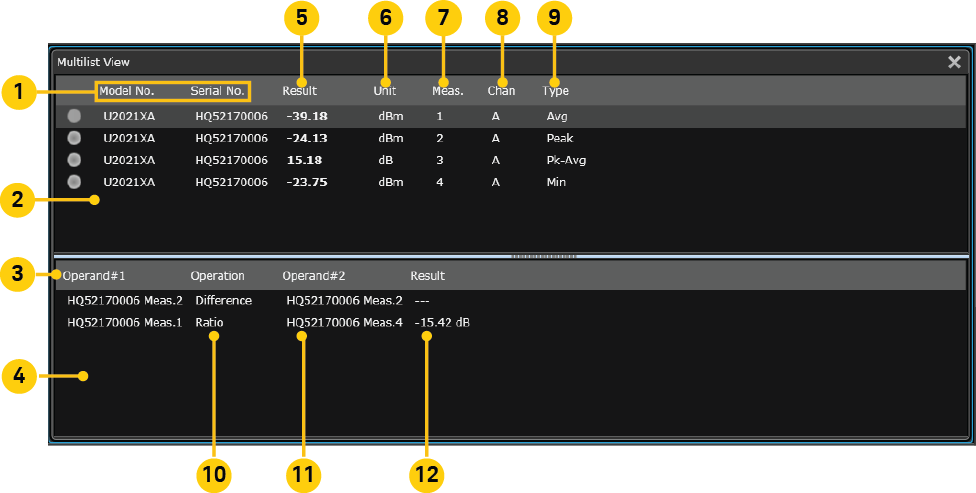
| 1 | Model number and serial number of connected instruments |
| 2 | Measurement list |
| 3 | 1st operand |
| 4 | Operation list |
| 5 | Measurement results |
| 6 | Measurement units |
| 7 | Measurement numbers |
| 8 | Channel names |
| 9 | Measurement types |
| 10 | Operation type (difference or ratio) |
| 11 | 2nd operand |
| 12 | Operation result |